SFD® Output Data
NXT’s survey aircraft carries numerous individual SFD® sensor elements, each of which generates its own unique output signal, captured as a digital time series. The signal is akin to a waveform, with the horizontal axis measuring flight time, in seconds, and the vertical axis a voltage output (V). Time readings correspond to a unique GPS based surface location and are plotted in the form of a flight line over the survey area. NXT’s data interpretation staff analyze deviations (such as signal relaxations and spikes) and other characteristics within the SFD® signal outputs from the multiple sensors, and from this process will identify “anomalous” areas within the survey grid.
SFD® data is acquired at 2,000 samples/second. The signal itself is intended to be an analog representation of the data collected during the flight but is represented as a non-linear, discrete-time signal of each sensor’s output voltage. Signal analysis (frequency, amplitude and character/pattern changes) and interpretation for each sensor is performed to identify prospective areas, without the aid of any a priori knowledge of the underlying geotechnical and engineering data along the SFD® flight path. The anomalies are also compared with NXT’s database of SFD® signals that have been obtained over various geological features worldwide, which serve as templates for interpretation. SFD® anomalies are then ranked and categorized according to their assessed prospectivity. Anomalous areas which are identified during the SFD® interpretation process are assigned a relative ranking, indicative of their assessed trap and reservoir potential.
Some sample SFD® signals are shown below.
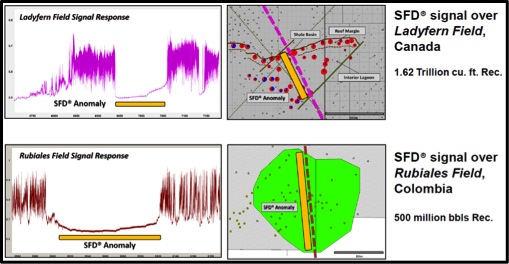
Interpretation of SFD® signals involves a pattern recognition process. Based on extensive experience, recognizable SFD® signal patterns (example above) have been empirically correlated to a variety of subsurface geologic conditions which are indicative of areas that are favorable for the formation of fluid traps.
The end product of the survey is a formal technical presentation by NXT of the SFD® Recommendations Report, which is a comprehensive summary of the results of the SFD® survey, including the following key deliverables:
Because the SFD® interpretation process is largely qualitative, NXT has developed a ranking system to evaluate each identified anomaly “lead”. The overall ranking is then reflected as two components – a trap ranking and a reservoir quality ranking. Each recommended SFD® lead area is assigned a number to denote trap quality and a letter to denote fluid presence indicators. A sample ranking system is illustrated below:
1 Fair trap potential
1+ Good trap potential
2 Very good trap potential
2+ Excellent trap potential
C No reservoir potential Indicated
C+ Poor reservoir potential
B- Minor reservoir potential
B Moderate reservoir potential
B+ Good reservoir potential
A Very good reservoir potential
A+ Excellent reservoir potential
Provided that the survey has been performed in a regular grid pattern (NXT normally recommends a 5 km by 5 km line spacing) or a quasi-grid pattern (i.e. 5 km by 7.5 km), the results are often represented in the form of a prospectivity map.
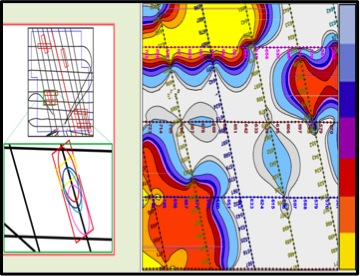
In order to map the assessed prospectivity of an area, the qualitative SFD® ranking must be further quantified. In cases where a grid pattern is flown, using a scoring system, NXT will create a prospectivity grid with hot colors indicating the higher quality lead areas versus cold colors showing lower assessed prospectivity areas. This map provides a contoured summary of the SFD® recommended lead areas and shows the estimated spatial extent and quality of the SFD® identified prospects